Test Design Techniques: State Transition Testing
Posted in Functional TestingPart one of the Test Design Technique series covered equivalence partitioning (EP). Part two of the Test Design Technique series covered the use of boundary value analysis (BVA). Part three of the Test Design Technique series covered the use of decision tables.
State transition testing is a test design technique to determine test scenarios based on the state of the system under test and the conditions that cause the transition. This method works well for systems where there are a finite number of possible states that can be acted upon. Testers determine the possible states the system can reach, the actions or events that cause a transition between states, and the result of the transitions. With this information, visual models can be created using two methods: state transition diagrams and state transition tables.
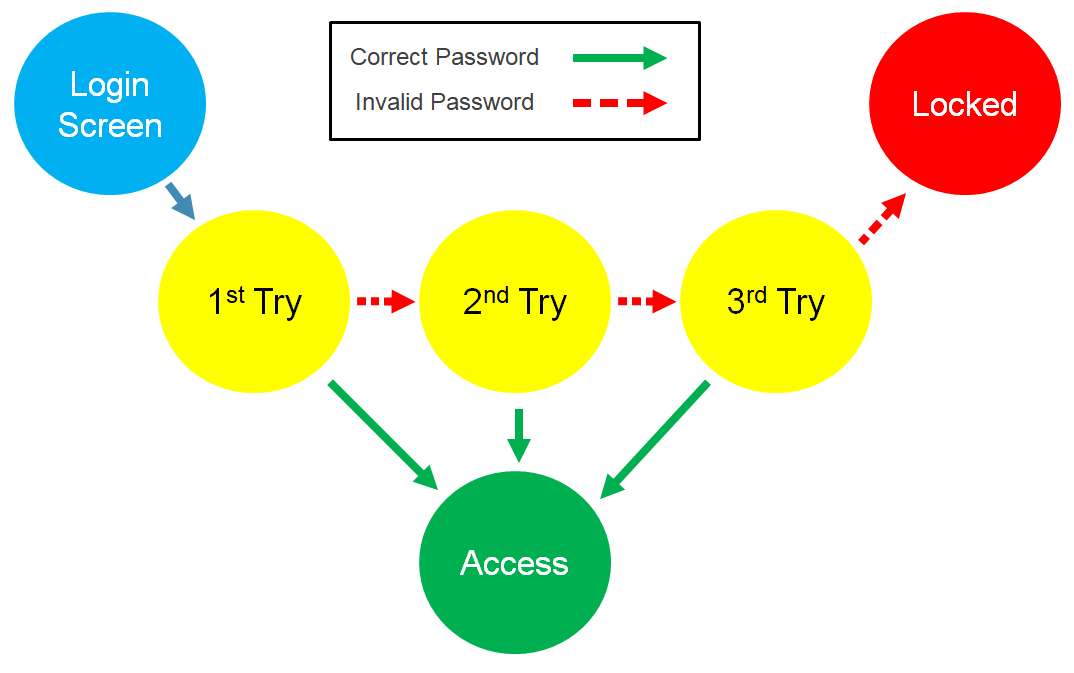
A state transition diagram usually consists of states, represented by shapes such as squares or circles, and transitions, represented by arrows that show one state going into another. An explanation of the event resulting in a transition is commonly put in text form near the arrows. In our example, we will use an account login system that either accepts the correct password or rejects an invalid password. After the third invalid attempt, the account will be locked. This diagram shows the initial state (login page), the states of the page at each login attempt, and the end states (either accepted or locked). Here, we have differentiated the transition arrows by color and solid/broken lines to show where the correct password or an invalid password has been entered.
A state transition table uses the same information to create a model in a table format. The table contains the states of the system in cells on the left side of the table. Columns to the right contain the events that occur and the results of each transition. Using our earlier example, here is a table containing the states of an account login system, the events that could possibly occur at each state (correct password or invalid password entered), and the resulting transition from each accepted or rejected login attempt.
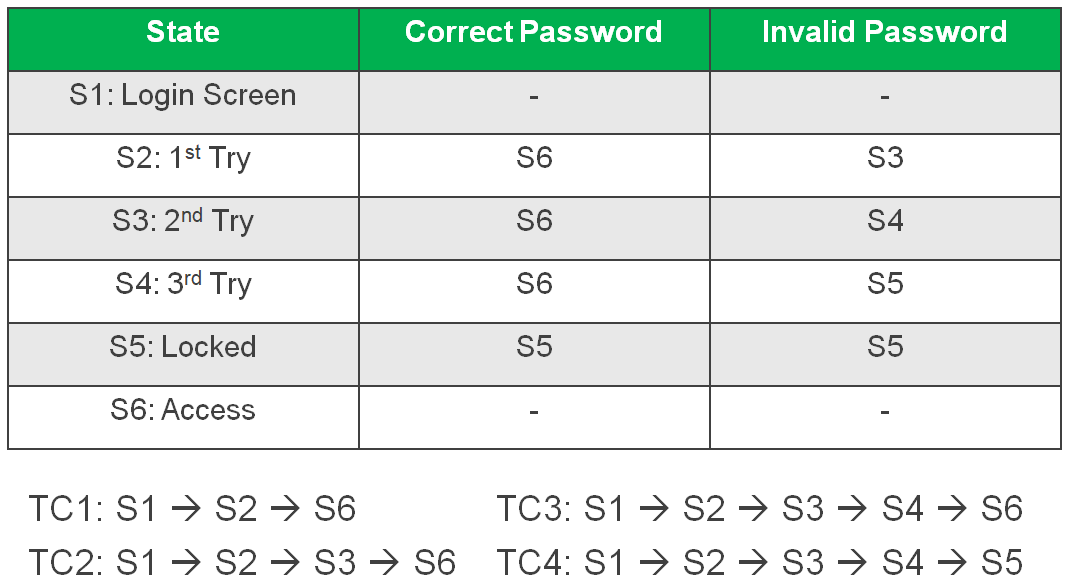
By creating these state transition diagrams or tables, we can determine the number of tests it would take to sufficiently test the system. In this case, we have four possible scenarios:
- Test Case 1: S1 → S2 → S6 (Password accepted on 1st attempt)
- Test Case 2: S1 → S2 → S3 → S6 (Password rejected on 1st attempt, accepted on 2nd attempt)
- Test Case 3: S1 → S2 → S3 → S4 → S6 (Password rejected on 1st & 2nd attempts, accepted on 3rd attempt)
- Test Case 4: S1 → S2 → S3 → S4 → S5 (Password rejected on 1st, 2nd, & 3rd attempts, account locked)
State transition diagrams or tables are often an easy way to visualize transitions between finite states, which can be helpful in determining test scenarios. However, when testing complex and advanced systems, it may not be feasible for testers to model a diagram or table. Software testers should attain the appropriate domain knowledge to ensure each event and transition is correctly mapped.